
How to Set the Right Growth Targets by Understanding Break-Even CAC
.jpg)
If you’re running an e-commerce, subscription or SaaS business, there’s one financial insight that can dramatically shift the way you think about growth:
The true goal of the LTV:CAC ratio is not to look “good on a slide deck.” It’s to help you calculate your break-even customer acquisition volume and set smarter, risk-adjusted growth targets.
And yet, most founders, marketers, and even investors misuse or misinterpret this metric, leading to flawed decisions, poor capital allocation, and sometimes, total failure.
Let’s correct that. In this article, we’ll show you:
- Why LTV:CAC was created in the first place.
- How to calculate it correctly.
- Why LTV:CAC is a risk metric, not a profit metric.
- And most importantly, how to calculate the minimum volume of customers you need to acquire to break even or scale profitably.
Why Break-Even Still Matters, Even in SaaS
In traditional businesses, calculating break-even is straightforward:
Break-even = Fixed Costs / Contribution per Unit
But in SaaS or subscription models, this gets trickier:
- Revenue is recurring across months.
- Acquisition costs are incurred upfront.
- Customers churn at different rates.
- And contribution margins are misunderstood
This misalignment in timeframes and assumptions makes traditional break-even analysis misleading. That’s exactly why LTV and CAC were created , to express unit-level contribution margins in recurring models.
LTV:CAC, A Tool to Calculate Break-Even Volume
Let’s quickly define what LTV and CAC actually are, if you want to do this right.
Lifetime Value (LTV)
LTV = Order Value × Contribution Margin % × Lifetime Retention
Where:
Contribution Margin = Revenue — Variable Costs
Lifetime Retention = 1 / (1 — Monthly Churn)
This gives you the net value a customer contributes across their entire lifetime, excluding fixed costs.
Customer Acquisition Cost (CAC)
CAC = Total Acquisition Spend / Customers Acquired
Only include variable costs directly tied to acquiring a customer (e.g. paid ads, affiliate commissions). Salaries, tools, or team costs are fixed and must not be included.
The Break-Even Formula
Now we bring it all together.
Break-even ($0 profit)
= Contribution Margin / Total Fixed costs= [Revenue — Total Variable Costs] / Total Fixed Costs
= [Margin on Variable Costs per customer * Quantity of customers] / Total Fixed Costs
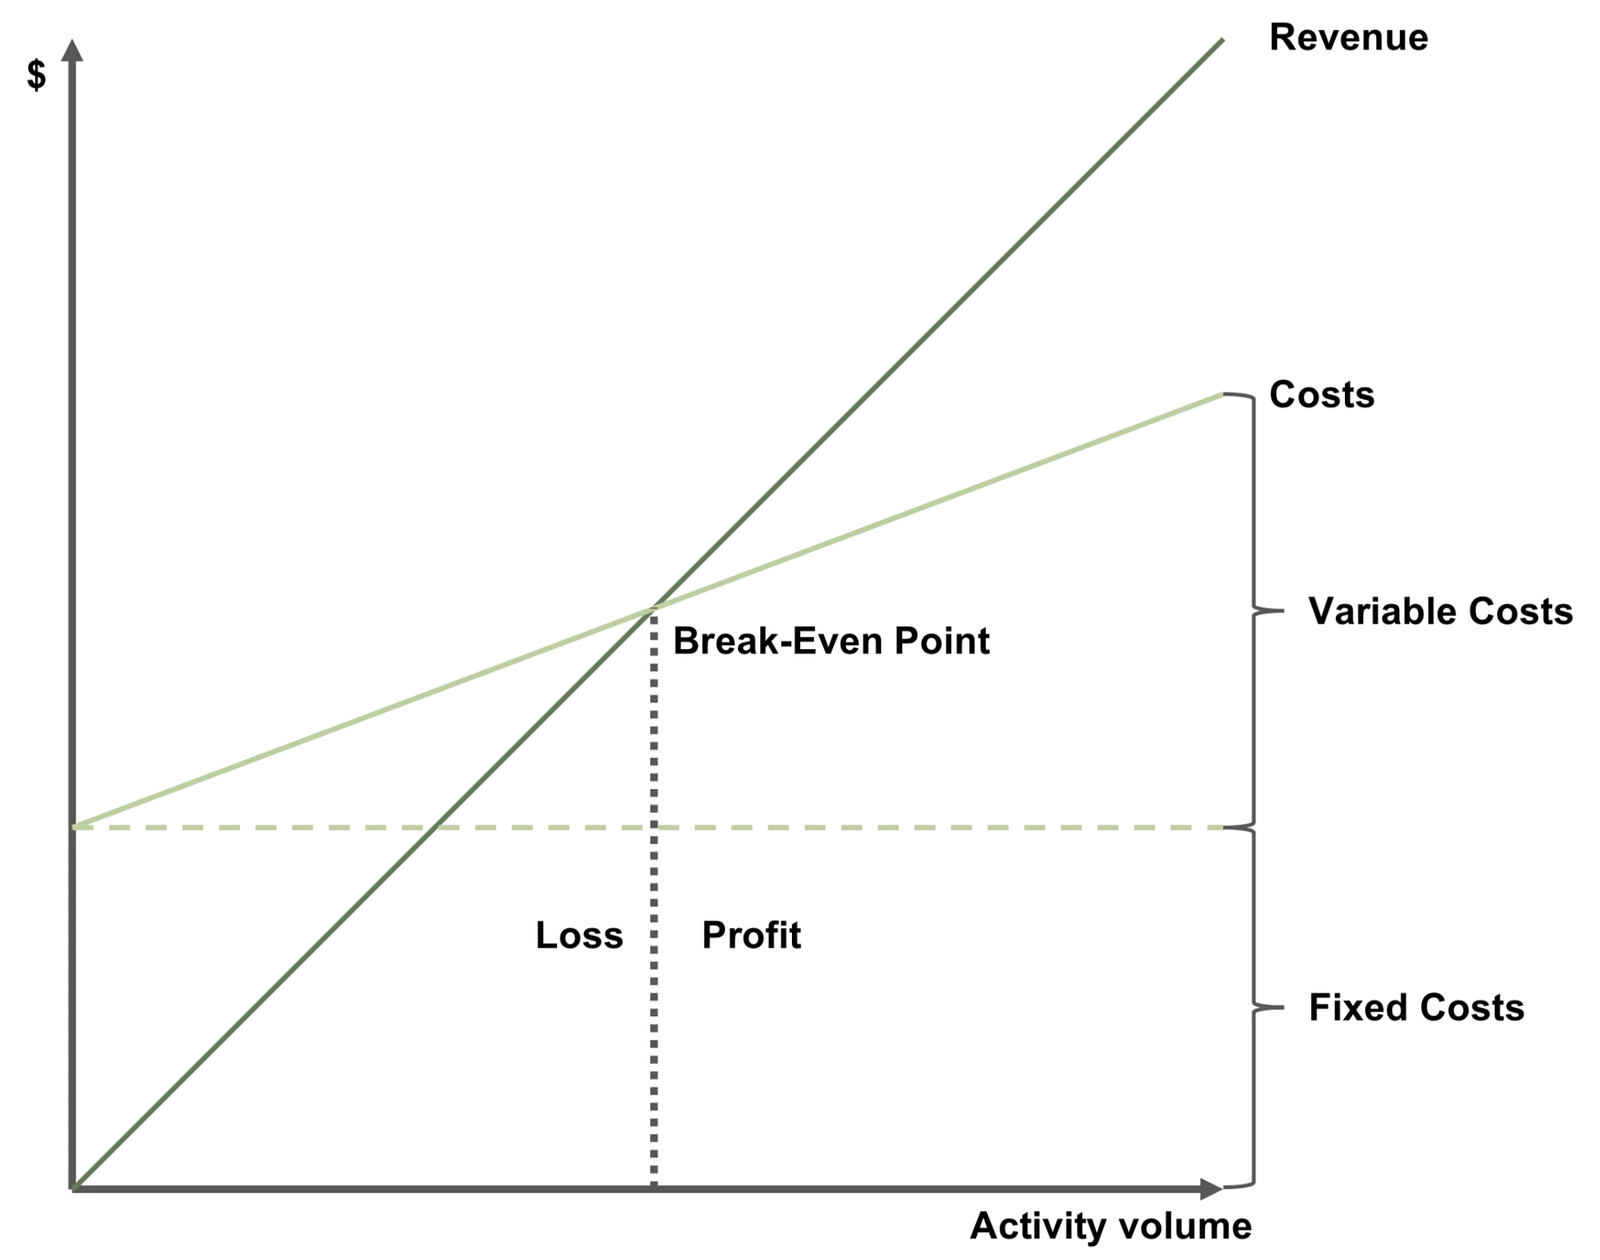
By breaking down the Contribution Margin to its unit economics with this formula, it becomes possible to assess the minimum activity volume required to become profitable, or the break-even price point.
The gap between these breakeven points and the reality of the business is what defines the business or investment risk, as it highlights the difficulty to breakeven or the comfort zone of profitability in case the business is already profitable.
However, apply this formula to the activity of a given month or year cannot accurately reflect the performance of subscription-based businesses, for two reasons:
- It doesn’t take into account customer retention, which has a significant impact on the Contribution Margin. This metric is at the core of the Break-Even analysis and corresponds to the margin on variable costs that contributes to the payback of the fixed costs.
- Because of retention and recurring revenues, the timeframes of acquisition cost and customer revenue are not aligned, which would lead to assimilating the acquisition cost to the wrong cohorts.
As a result, the Contribution Margin in a given month or year wouldn’t reflect the true value of customers, and would not represent the correctly-related acquisition costs.
Break-even volume or price points would therefore be flawed, being artificially increased or decreased.
To overcome this issue, the LTV:CAC ratio was developed.
Here’s how you calculate the number of customers required to break even:
Break-Even Volume = Fixed Costs / (LTV — CAC)
This formula gives you a real, tangible target.
💡 Example:
- Fixed Costs = $50,000
- LTV = $400
- CAC = $150
→ Break-Even Volume = $50,000 / ($400 — $150) = 200 customers
This means: if you acquire 200 customers at $150 CAC and they’re worth $400 each over their lifetime, your business hits break-even.
Lesson #1: Don’t Pollute CAC or LTV with Fixed or Direct Costs
This is where most people get it wrong. They include:
- Marketing team salaries in CAC
- Fulfilment or customer service salaries in LTV
- Office rent in “unit economics”
- These are fixed or direct costs, not variable. And the moment you include them, your break-even formula becomes invalid: it either overstates CAC or understates LTV, leading to wrong conclusions.
Worst-case scenario? You stop growing because your unit economics “look unprofitable”, when in fact, you just included costs that are supposed to be excluded.
Lesson #2: LTV:CAC Ratio Doesn’t Matter, LTV Minus CAC Does
Let’s compare two businesses:
- Company A
LTV = $100
CAC = $50
Ratio = 2:1
LTV — CAC = $50 - Company B
LTV = $2
CAC = $1
Ratio = 2:1
LTV — CAC = $1
Same ratio, but radically different business outcomes.
If both have $100 in fixed costs:
- Company A breaks even after 2 customers
- Company B needs 100 customers
That’s why LTV minus CAC is more important than the ratio , it tells you the real monetary contribution per customer, which you can scale up to plan for profitability.
Setting Smarter Growth Targets
Once you’ve figured out your break-even volume, you can plan growth like this:
- Target monthly profit = $30,000
- Fixed Costs = $70,000
- LTV = $500, CAC = $200
→ Contribution per customer = $300
→ Required volume = ($70,000 + $30,000) / $300 = 333 customers/month
That’s your real growth target, grounded in your business model.
Stick to Definitions. Avoid Cost Confusion.
Let’s recap the rules:
- LTV and CAC only include variable costs
- Fixed or direct costs ≠ variable costs
- Contribution margin ≠ gross margin
- Use LTV — CAC, not just the ratio
- Break-even volume is the most useful output
By following this framework, you’ll be able to:
- Forecast profitability more accurately
- Justify marketing spend
- Set defendable growth targets for teams or investors
- Avoid dangerous misinterpretations of your own numbers
Sources:
- R. Kamp: Application of Break-Even Point Analysis, 2016
- Xi Chen and Bertrand M. Koebel: Fixed Cost, Variable Cost, Markups and Returns to Scale
- https://www.investopedia.com/ask/answers/122314/what-difference-between-gross-margin-and-contribution-margin.asp#:~:text=The%20contribution%20margin%20is%20calculated,10%2C000%20%2D%20%246%2C000)%20%2F%20%2410%2C000.
- https://www.investopedia.com/ask/answers/032515/what-difference-between-variable-cost-and-fixed-cost-economics.asp
evercleaner
Case study
- Revenue from $0 to $200k+ monthly within 18 months
- Significantly grew monthly customer acquisitions via Meta & TikTok
- Profitably scaled the Meta & TikTok ads budget from $5k monthly to $100k

.png)


Free Guide: The Proven Partnership Ads Playbook
The exact system we use to cut CAC by up to 70% and 2-3x ROAS. Backed by $3M/month in ad data.
.png)
%20(1).png)